
The short answer
Keep the chart's message clear and provide the underlying values and qualifications in text.
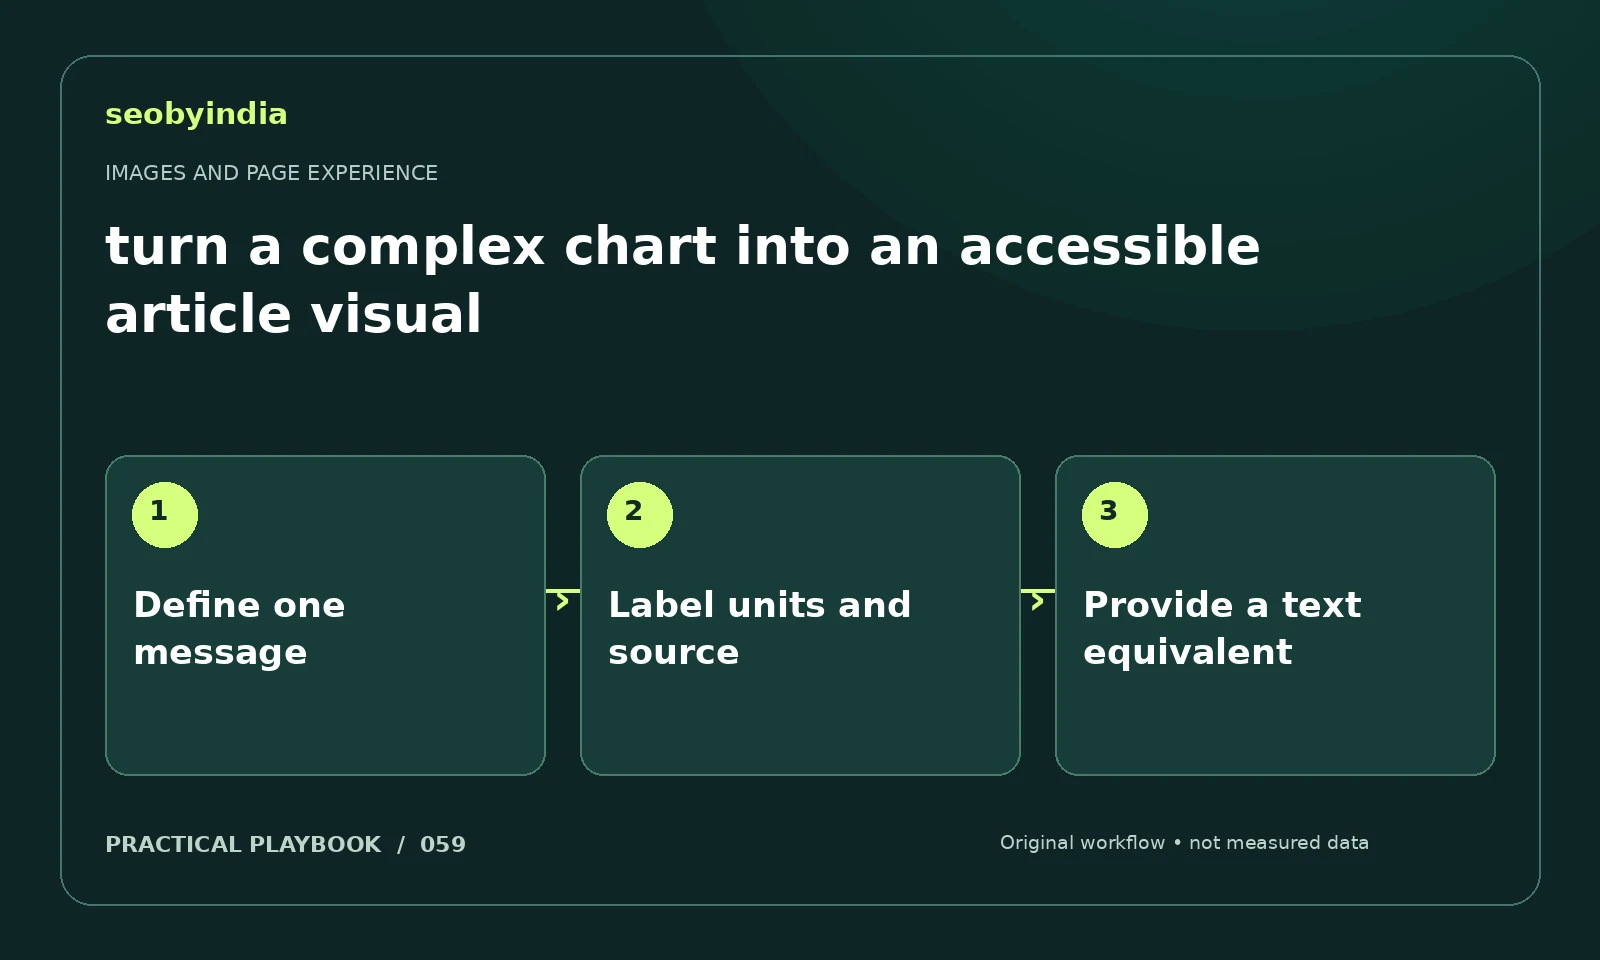
A three-step workflow
Define one message
Choose the one comparison or trend that readers need to understand. Remove elements that do not contribute to that message.
Label units and source
Label the metric, units, dates and source directly. Use patterns or text where color alone would exclude some readers.
Provide a text equivalent
Provide the underlying values in a readable table or explanation. Describe the main conclusion and the limitations of the evidence.
Illustrative example
Put the decision in context
A comparison of channels should show a defined metric and time period. Publish the table below the chart so readers can inspect exact values.
What to record in your working sheet
Keep the evidence beside the decision so the work can be checked and handed over. For this task, use these fields:
- Page URL and image or interaction
- Reader purpose and expected behavior
- Observed usability or loading issue
- Asset change and before/after check
A mistake to avoid
Using color alone to distinguish categories.
References and further reading
The workflow and illustrative example are SEOByIndia editorial guidance. Use the linked primary documentation for platform requirements; interfaces and policies can change.
Need help applying this to your site?
Share your website, the problem you are investigating and the evidence you already have. We can discuss a focused scope and the next useful check.
Discuss a page experience review